 杭州浙大迪迅生物基因工程有限公司
JACI:花生组分特异性IgE在预测花生过敏中的作用研究
发布日期:2019-11-18
原标题:花生提取物和花生组分特异性IgE在预测花生过敏中的作用
根据口服食物激发试验的结果,我们最近发现大部分对花生提取物敏感的儿童并没有花生过敏。在英国以普通人群为基础的出生队列中,大约有10%的8岁儿童对花生敏感,但只有大约2%的儿童对花生过敏,大约8%的儿童对花生敏感但耐受。通过使用微阵列组分诊断对花生敏感的儿童进行检测,我们发现花生过敏者和花生耐受者之间的组分敏感程度存在显著差异,其中IgE对Ara h2的反应性是过敏最重要的预测因子。然而,尽管这项技术取得了进步,但由于涉及标准化、成本和解释方面的问题,这项工具还不能作为常规使用。在本研究中,我们的目的是使用标准的 ImmunoCAP(Phadia, Uppsala,瑞典)比较花生提取物sIgE与和花生组分Ara h1、2、3、8和9sIgE的定量值,以预测花生过敏或耐受。
在参与初始研究的花生提取物 sIgE阳性的 81例儿童(7-14岁)中,(29例花生过敏和52例花生耐受性)中,80例Ara h2特异性IgE阳性,66例(27例花生过敏和39例花生耐受性)对花生所有组分特异性IgE均为阳性。如前所述,花生过敏是通过口服食物激发来确诊的。在出现至少2种客观症状(如皮疹、打喷嚏、呕吐、咳嗽、喘息、FEV1下降>20%)后,才认为是阳性。
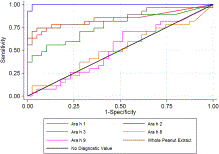
我们用ROC曲线分析比较不同组分特异性IgE和提取物特异性IgE测定在区分花生过敏和花生耐受上的诊断性能(Stata 11.0;StataCorp, College Station, Tex)。图1显示了花生组分和提取液sIgE不同cut-off值的真阳性率(灵敏度)与假阳性率(1-特异度)的函数关系。ROC曲线上的每个点代表一个特定的阈值对应的敏感性/特异性。区别度最理想的测试的ROC曲线通过左上角(100%敏感性和100%特异性)。因此,ROC曲线越靠近左上角,测试的总体精度越高。根据这一标准,sIgE对Ara h2的测定似乎是区分过敏和耐受的准确性最高的测试。
我们使用ROC曲线下的估算面积作为诊断准确性的指标,观察到不同测试之间的显著差异(χ2 = 61.59,P <0.001)。如ROC曲线下的估算面积所示,,Ara h 2特异性IgE在区分花生过敏和花生耐受儿童上有最高的准确度:面积(95% CI), Ara h 2 0.99(0.99 - -1.00),花生提取0.85 (0.74 - -0.96),Ara h 1 0.84 (0.73 - -0.95), Ara h 3 0.77 (0.64 - -0.89), Ara h 9 0.52(0.37 - -0.66),和Ara h 8 0.50 (0.36 - -0.65)。
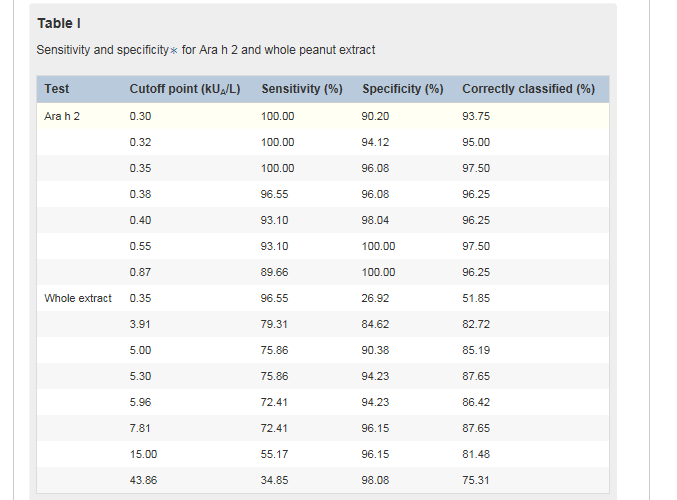
表I显示了基于灵敏度和特异性的Ara h2组分和花生提取物的cut-off值的范围,因为对单个cut-off值的灵敏度和特异性的测量可能不足以评估最佳诊断试验。作为一个例子,我们考虑了一个假设的场景,我们试图在100名对花生敏感的儿童中区分花生过敏和耐受,其中50名儿童对花生过敏,50名儿童对花生耐受。以0.35 kUA/L为分界点,用sIgE对Ara h2进行分界,可对所有花生过敏儿童进行正确分类。本试验的特异性为96.1%(表一)。在本例中,我们预计有2名对花生不过敏的儿童被误诊为花生过敏,另外48名儿童为阴性。通过使用这个分界点,97.5%的人被正确区分。
使用0.55 kUA/L的cut-off值可以正确地分类类似比例的儿童;然而,在这种情况下,3名花生过敏的儿童将被误认为耐受性。这个cut-off值对应的是特异性增加(100%),而敏感性减少(93.1%)。考虑到不要将花生过敏儿童误诊为具有耐受性的重要性,我们建议我们人群的最佳临界值(cutoff值)为0.35 kUA/L。
5.30 kUA/L作为花生全提物sIgE的cut-off值,正确区分受试者比例最高(87.6%),敏感性为75.9%,特异性为94.2%。然而,约24%的花生过敏儿童将被不恰当地归类为花生耐受。15 kUA/L的临界值具有良好的特异性,96.2%高于此水平的儿童被正确归类为花生过敏;然而,这个cut-off值的敏感性相对较差,几乎一半的花生过敏者被归类为耐受。这些数据表明,在我们的人群中,花生全提液sIgE的定量与Ara h2 sIgE定量相比,在鉴别花生过敏和耐受方面的准确性较低。
综上所述,利用微阵列技术检测 Ara h2 sIgE 是预测花生临床反应性的重要因子,我们现在通过常规的实验室检测证实了 Ara h2 sIgE 定量的价值。在英国学龄儿童中,0.35 kUA/L Ara h2 IgE的cut-off值为100%的敏感性和96.1%的特异性。使用这个cutoff值,我们的研究人群中97.5%的受试者被正确区分,所有花生过敏儿童都被正确的归类。来自其它中欧和北欧国家的研究也表明Ara h2的重要性;然而,在其他人群和地理区域,IgE可能与其他组分相关(例如,地中海地区为Ara h9)。我们的发现需要在其他人群和年龄组中进行重复,然后才能普遍应用。
延伸阅读
JACI
Quantification of specific IgE to whole peanut extract and peanut components in prediction of peanut allergy
DOI:org/10.1016/j.jaci.2010.12.012
Peanut allergy is one of the most common, severe, and usually lifelong food allergies, and accurate diagnosis is essential.1x1Sicherer, S.H. and Sampson, H.A. Peanut allergy: emerging concepts and approaches for an apparent epidemic. J Allergy Clin Immunol. 2007; 120: 491–503
Abstract | Full Text | Full Text PDF | PubMed | Scopus (265) | Google ScholarSee all References The double–blind, placebo-controlled food challenge is the gold standard for diagnosing peanut allergy, but the procedure is time-consuming and expensive, and patients might be at risk of a severe reaction.2x2Roberts, G. and Lack, G. Diagnosing peanut allergy with skin prick and specific IgE testing. J Allergy Clin Immunol. 2005; 115: 1291–1296
Abstract | Full Text | Full Text PDF | PubMed | Scopus (197) | Google ScholarSee all References Currently, a level of specific IgE (sIgE) to whole peanut extract of 15 kUA/L or higher is used to predict peanut allergy with greater than 95% certainty,2x2Roberts, G. and Lack, G. Diagnosing peanut allergy with skin prick and specific IgE testing. J Allergy Clin Immunol. 2005; 115: 1291–1296
Abstract | Full Text | Full Text PDF | PubMed | Scopus (197) | Google ScholarSee all References, 3x3Sampson, H.A. and Ho, D.G. Relationship between food-specific IgE concentrations and the risk of positive food challenges in children and adolescents. J Allergy Clin Immunol. 1997; 100: 444–451
Abstract | Full Text | Full Text PDF | PubMed | Scopus (914) | Google ScholarSee all References, 4x4van Nieuwaal, N.H., Lasfar, W., Meijer, Y., Kentie, P.A., Flinterman, A.E., Pasmans, S.G. et al. Utility of peanut-specific IgE levels in predicting the outcome of double-blind, placebo-controlled food challenges. J Allergy Clin Immunol. 2010; 125: 1391–1392
Abstract | Full Text | Full Text PDF | PubMed | Scopus (24) | Google ScholarSee all References but many subjects with peanut allergy have lower sIgE levels.2x2Roberts, G. and Lack, G. Diagnosing peanut allergy with skin prick and specific IgE testing. J Allergy Clin Immunol. 2005; 115: 1291–1296
Abstract | Full Text | Full Text PDF | PubMed | Scopus (197) | Google ScholarSee all References, 5
On the basis of the outcome of oral food challenge, we have recently shown that the majority of children sensitized to whole peanut extract do not have peanut allergy. Approximately 10% of 8-year-old children in our population-based birth cohort in the United Kingdom were sensitized to peanut, but only approximately 2% had peanut allergy, and approximately 8% were sensitized but peanut tolerant.5x5Nicolaou, N., Poorafshar, M., Murray, C., Simpson, A., Winell, H., Kerry, G. et al. Allergy or tolerance in children sensitized to peanut: prevalence and differentiation using component-resolved diagnostics. J Allergy Clin Immunol. 2010; 125: 191–197 (e1-13)
Abstract | Full Text | Full Text PDF | PubMed | Scopus (291) | Google ScholarSee all References By using microarray component-resolved diagnostics among peanut-sensitized children, we demonstrated marked differences in the component sensitization profile between subjects with peanut allergy and peanut-tolerant subjects, with IgE response to Ara h 2 being the most important predictor of allergy.5x5Nicolaou, N., Poorafshar, M., Murray, C., Simpson, A., Winell, H., Kerry, G. et al. Allergy or tolerance in children sensitized to peanut: prevalence and differentiation using component-resolved diagnostics. J Allergy Clin Immunol. 2010; 125: 191–197 (e1-13)
Abstract | Full Text | Full Text PDF | PubMed | Scopus (291) | Google ScholarSee all References However, despite progress in this technology, because of issues related to standardization, cost, and interpretation, this tool is not as yet ready for routine use. In the current study we aimed to compare the quantification of sIgE to whole peanut extract and the peanut components Ara h 1, 2, 3, 8, and 9 using the standard ImmunoCAP method (Phadia, Uppsala, Sweden) in predicting peanut allergy or tolerance.
Of 81 children (age, 7-14 years) with sIgE to whole peanut extract who participated in the original study (29 with peanut allergy and 52 peanut-tolerant),5x5Nicolaou, N., Poorafshar, M., Murray, C., Simpson, A., Winell, H., Kerry, G. et al. Allergy or tolerance in children sensitized to peanut: prevalence and differentiation using component-resolved diagnostics. J Allergy Clin Immunol. 2010; 125: 191–197 (e1-13)
Abstract | Full Text | Full Text PDF | PubMed | Scopus (291) | Google ScholarSee all References 80 had sIgE to Ara h 2, and 66 (27 with peanut allergy and 39 peanut-tolerant) had sIgE to all components. Peanut allergy was confirmed by means of oral food challenge, as previously described.5x5Nicolaou, N., Poorafshar, M., Murray, C., Simpson, A., Winell, H., Kerry, G. et al. Allergy or tolerance in children sensitized to peanut: prevalence and differentiation using component-resolved diagnostics. J Allergy Clin Immunol. 2010; 125: 191–197 (e1-13)
Abstract | Full Text | Full Text PDF | PubMed | Scopus (291) | Google ScholarSee all References Challenge was considered positive after development of at least 2 objective signs (eg, skin rash, sneezing, vomiting, cough, wheeze, and >20% decrease in FEV1).5
We compared the diagnostic performance of sIgE measurement to different components and whole extract in discriminating between subjects with peanut allergy and those tolerant to peanut using receiver operating characteristic (ROC) curve analysis6x6Zweig, M.H. and Campbell, G. Receiver-operating characteristic (ROC) plots: a fundamental evaluation tool in Clinical Medicine. Clin Chem. 1993; 39: 561–577
PubMed | Google ScholarSee all References (Stata 11.0; StataCorp, College Station, Tex). Fig 1Fig 1 shows the true-positive rate (sensitivity) plotted in function of the false-positive rate (1-specificity) for different cutoff points for the quantified components and whole peanut extract. Each point on the ROC curve represents a sensitivity/specificity pair corresponding to a particular decision threshold. A test with perfect discrimination has a ROC curve that passes through the upper left corner (100% sensitivity and 100% specificity). Therefore the closer the ROC plot is to the upper left corner, the higher the overall accuracy of the test.6x6Zweig, M.H. and Campbell, G. Receiver-operating characteristic (ROC) plots: a fundamental evaluation tool in Clinical Medicine. Clin Chem. 1993; 39: 561–577
PubMed | Google ScholarSee all References According to this criterion, sIgE measurement to Ara h 2 appears to be the test with the highest accuracy for discriminating allergy from tolerance.
We used estimated area under the ROC curves as an indicator of diagnostic accuracy and observed a significant difference between the tests (χ2 = 61.59, P < .001). As indicated by the estimated area under the ROC curves, sIgE to Ara h 2 had the highest accuracy in differentiating between children with peanut allergy and those tolerant to peanut: area (95% CI), Ara h 2 0.99 (0.99-1.00), whole peanut extract 0.85 (0.74-0.96), Ara h 1 0.84 (0.73-0.95), Ara h 3 0.77 (0.64-0.89), Ara h 9 0.52 (0.37-0.66), and Ara h 8 0.50 (0.36-0.65).
Table ITable I shows a range of cutoff points for component Ara h 2 and whole peanut extract based on sensitivity and specificity because the measure of sensitivity and specificity for a single cutoff point might be inadequate for evaluating the optimal diagnostic test. As an example, we considered a hypothetical scenario in which we are seeking to discriminate allergy from tolerance among 100 children sensitized to peanuts, of whom 50 have peanut allergy and 50 are peanut-tolerant. By using sIgE to component Ara h 2 with a cutoff point of 0.35 kUA/L, all children with peanut allergy would be correctly classified. The specificity of this test is given as 96.1% (Table ITable I). In this example we expect 2 children who are not allergic to peanuts to be misclassified as having peanut allergy and the other 48 children to have a negative result. By using this cutoff point, 97.5% of the population is correctly classified.
A similar proportion of children would be correctly classified by using a cutoff point of 0.55 kUA/L; however, in this case 3 children with peanut allergy would be misclassified as tolerant. This cutoff point corresponds to a gain in specificity (100%) but a loss in sensitivity (93.1%). Given the importance of not misdiagnosing children with peanut allergy as being tolerant, we propose that the optimal cutoff point in our population is 0.35 kUA/L.
The cutoff for whole peanut sIgE of 5.30 kUA/L provides the maximum proportion of correctly classified subjects (87.6%), with a sensitivity of 75.9% and a specificity of 94.2%. However, approximately 24% of children with peanut allergy would be inappropriately classified as peanut-tolerant. The cutoff of 15 kUA/L has excellent specificity, with 96.2% of children at greater than this level being correctly classified as allergic; however, this decision point has relatively poor sensitivity, with almost half of the subjects with peanut allergy being classified as tolerant. These data suggest that in our population the quantification of whole peanut sIgE has lower accuracy in discriminating peanut allergy from tolerance compared with quantification of sIgE to Ara h 2.
In conclusion, having identified sIgE to Ara h 2 as an important predictor of clinical reactivity to peanut using microarray technology,5x5Nicolaou, N., Poorafshar, M., Murray, C., Simpson, A., Winell, H., Kerry, G. et al. Allergy or tolerance in children sensitized to peanut: prevalence and differentiation using component-resolved diagnostics. J Allergy Clin Immunol. 2010; 125: 191–197 (e1-13)
Abstract | Full Text | Full Text PDF | PubMed | Scopus (291) | Google ScholarSee all References we have now demonstrated the value of its quantification using a routinely available laboratory test. Among school-aged children in the United Kingdom, a cutoff of 0.35 kUA/L Ara h 2 IgE confers 100% sensitivity and 96.1% specificity. By using this cutoff point, 97.5% of the subjects in our study population were correctly classified, with all children with peanut allergy given the correct classification. The importance of Ara h 2 has been suggested in studies from other Central and Northern European countries7x7Astier, C., Morisset, M., Roitel, O., Codreanu, F., Jacquenet, S., Franck, P. et al. Predictive value of skin prick tests using recombinant allergens for diagnosis of peanut allergy. J Allergy Clin Immunol. 2006; 118: 250–256
Abstract | Full Text | Full Text PDF | PubMed | Scopus (163) | Google ScholarSee all References, 8x8Flinterman, A.E., van Hoffen, E., den Hartog Jager, C.F., Koppelman, S., Pasmans, S.G., Hoekstra, M.O. et al. Children with peanut allergy recognize predominantly Ara h2 and Ara h6, which remains stable over time. Clin Exp Allergy. 2007; 37: 1221–1228
Crossref | PubMed | Scopus (101) | Google ScholarSee all References; however, in other populations and geographic areas, IgE to other components might be relevant (eg, Ara h 9 in the Mediterranean9x9Krause, S., Reese, G., Randow, S., Zennaro, D., Quaratino, D., Palazzo, P. et al. Lipid transfer protein (Ara h 9) as a new peanut allergen relevant for a Mediterranean allergic population. J Allergy Clin Immunol. 2009; 124: 771–778 (e5)
Abstract | Full Text | Full Text PDF | PubMed | Scopus (144) | Google ScholarSee all References). Our findings need to be replicated in other populations and age groups before general application.
All Author:
Nicolaos Nicolaou Clare Murray Maryam Poorafshar Angela Simpson Adnan Custovic
创建过敏性疾病的科研、科普知识交流平台,为过敏患者提供专业诊断、治疗、预防的共享平台。


——浙大迪迅 译
花生过敏是最常见、最严重、最常见的终身食物过敏之一,准确的诊断至关重要。双盲、安慰剂对照的食物激发试验是诊断花生过敏的金标准,但是这个过程既耗时又费钱,而且病人可能有严重反应的风险。目前,15 kUA/L或更高的花生提取物特异性IgE (sIgE)水平被用来预测花生过敏,其准确率大于95%,但有许多花生过敏的受试者sIgE水平较低。根据口服食物激发试验的结果,我们最近发现大部分对花生提取物敏感的儿童并没有花生过敏。在英国以普通人群为基础的出生队列中,大约有10%的8岁儿童对花生敏感,但只有大约2%的儿童对花生过敏,大约8%的儿童对花生敏感但耐受。通过使用微阵列组分诊断对花生敏感的儿童进行检测,我们发现花生过敏者和花生耐受者之间的组分敏感程度存在显著差异,其中IgE对Ara h2的反应性是过敏最重要的预测因子。然而,尽管这项技术取得了进步,但由于涉及标准化、成本和解释方面的问题,这项工具还不能作为常规使用。在本研究中,我们的目的是使用标准的 ImmunoCAP(Phadia, Uppsala,瑞典)比较花生提取物sIgE与和花生组分Ara h1、2、3、8和9sIgE的定量值,以预测花生过敏或耐受。
在参与初始研究的花生提取物 sIgE阳性的 81例儿童(7-14岁)中,(29例花生过敏和52例花生耐受性)中,80例Ara h2特异性IgE阳性,66例(27例花生过敏和39例花生耐受性)对花生所有组分特异性IgE均为阳性。如前所述,花生过敏是通过口服食物激发来确诊的。在出现至少2种客观症状(如皮疹、打喷嚏、呕吐、咳嗽、喘息、FEV1下降>20%)后,才认为是阳性。
我们用ROC曲线分析比较不同组分特异性IgE和提取物特异性IgE测定在区分花生过敏和花生耐受上的诊断性能(Stata 11.0;StataCorp, College Station, Tex)。图1显示了花生组分和提取液sIgE不同cut-off值的真阳性率(灵敏度)与假阳性率(1-特异度)的函数关系。ROC曲线上的每个点代表一个特定的阈值对应的敏感性/特异性。区别度最理想的测试的ROC曲线通过左上角(100%敏感性和100%特异性)。因此,ROC曲线越靠近左上角,测试的总体精度越高。根据这一标准,sIgE对Ara h2的测定似乎是区分过敏和耐受的准确性最高的测试。
我们使用ROC曲线下的估算面积作为诊断准确性的指标,观察到不同测试之间的显著差异(χ2 = 61.59,P <0.001)。如ROC曲线下的估算面积所示,,Ara h 2特异性IgE在区分花生过敏和花生耐受儿童上有最高的准确度:面积(95% CI), Ara h 2 0.99(0.99 - -1.00),花生提取0.85 (0.74 - -0.96),Ara h 1 0.84 (0.73 - -0.95), Ara h 3 0.77 (0.64 - -0.89), Ara h 9 0.52(0.37 - -0.66),和Ara h 8 0.50 (0.36 - -0.65)。
表I显示了基于灵敏度和特异性的Ara h2组分和花生提取物的cut-off值的范围,因为对单个cut-off值的灵敏度和特异性的测量可能不足以评估最佳诊断试验。作为一个例子,我们考虑了一个假设的场景,我们试图在100名对花生敏感的儿童中区分花生过敏和耐受,其中50名儿童对花生过敏,50名儿童对花生耐受。以0.35 kUA/L为分界点,用sIgE对Ara h2进行分界,可对所有花生过敏儿童进行正确分类。本试验的特异性为96.1%(表一)。在本例中,我们预计有2名对花生不过敏的儿童被误诊为花生过敏,另外48名儿童为阴性。通过使用这个分界点,97.5%的人被正确区分。
使用0.55 kUA/L的cut-off值可以正确地分类类似比例的儿童;然而,在这种情况下,3名花生过敏的儿童将被误认为耐受性。这个cut-off值对应的是特异性增加(100%),而敏感性减少(93.1%)。考虑到不要将花生过敏儿童误诊为具有耐受性的重要性,我们建议我们人群的最佳临界值(cutoff值)为0.35 kUA/L。
5.30 kUA/L作为花生全提物sIgE的cut-off值,正确区分受试者比例最高(87.6%),敏感性为75.9%,特异性为94.2%。然而,约24%的花生过敏儿童将被不恰当地归类为花生耐受。15 kUA/L的临界值具有良好的特异性,96.2%高于此水平的儿童被正确归类为花生过敏;然而,这个cut-off值的敏感性相对较差,几乎一半的花生过敏者被归类为耐受。这些数据表明,在我们的人群中,花生全提液sIgE的定量与Ara h2 sIgE定量相比,在鉴别花生过敏和耐受方面的准确性较低。
综上所述,利用微阵列技术检测 Ara h2 sIgE 是预测花生临床反应性的重要因子,我们现在通过常规的实验室检测证实了 Ara h2 sIgE 定量的价值。在英国学龄儿童中,0.35 kUA/L Ara h2 IgE的cut-off值为100%的敏感性和96.1%的特异性。使用这个cutoff值,我们的研究人群中97.5%的受试者被正确区分,所有花生过敏儿童都被正确的归类。来自其它中欧和北欧国家的研究也表明Ara h2的重要性;然而,在其他人群和地理区域,IgE可能与其他组分相关(例如,地中海地区为Ara h9)。我们的发现需要在其他人群和年龄组中进行重复,然后才能普遍应用。
延伸阅读
JACI
[IF:13.1]
Quantification of specific IgE to whole peanut extract and peanut components in prediction of peanut allergy
DOI:org/10.1016/j.jaci.2010.12.012
Peanut allergy is one of the most common, severe, and usually lifelong food allergies, and accurate diagnosis is essential.1x1Sicherer, S.H. and Sampson, H.A. Peanut allergy: emerging concepts and approaches for an apparent epidemic. J Allergy Clin Immunol. 2007; 120: 491–503
Abstract | Full Text | Full Text PDF | PubMed | Scopus (265) | Google ScholarSee all References The double–blind, placebo-controlled food challenge is the gold standard for diagnosing peanut allergy, but the procedure is time-consuming and expensive, and patients might be at risk of a severe reaction.2x2Roberts, G. and Lack, G. Diagnosing peanut allergy with skin prick and specific IgE testing. J Allergy Clin Immunol. 2005; 115: 1291–1296
Abstract | Full Text | Full Text PDF | PubMed | Scopus (197) | Google ScholarSee all References Currently, a level of specific IgE (sIgE) to whole peanut extract of 15 kUA/L or higher is used to predict peanut allergy with greater than 95% certainty,2x2Roberts, G. and Lack, G. Diagnosing peanut allergy with skin prick and specific IgE testing. J Allergy Clin Immunol. 2005; 115: 1291–1296
Abstract | Full Text | Full Text PDF | PubMed | Scopus (197) | Google ScholarSee all References, 3x3Sampson, H.A. and Ho, D.G. Relationship between food-specific IgE concentrations and the risk of positive food challenges in children and adolescents. J Allergy Clin Immunol. 1997; 100: 444–451
Abstract | Full Text | Full Text PDF | PubMed | Scopus (914) | Google ScholarSee all References, 4x4van Nieuwaal, N.H., Lasfar, W., Meijer, Y., Kentie, P.A., Flinterman, A.E., Pasmans, S.G. et al. Utility of peanut-specific IgE levels in predicting the outcome of double-blind, placebo-controlled food challenges. J Allergy Clin Immunol. 2010; 125: 1391–1392
Abstract | Full Text | Full Text PDF | PubMed | Scopus (24) | Google ScholarSee all References but many subjects with peanut allergy have lower sIgE levels.2x2Roberts, G. and Lack, G. Diagnosing peanut allergy with skin prick and specific IgE testing. J Allergy Clin Immunol. 2005; 115: 1291–1296
Abstract | Full Text | Full Text PDF | PubMed | Scopus (197) | Google ScholarSee all References, 5
On the basis of the outcome of oral food challenge, we have recently shown that the majority of children sensitized to whole peanut extract do not have peanut allergy. Approximately 10% of 8-year-old children in our population-based birth cohort in the United Kingdom were sensitized to peanut, but only approximately 2% had peanut allergy, and approximately 8% were sensitized but peanut tolerant.5x5Nicolaou, N., Poorafshar, M., Murray, C., Simpson, A., Winell, H., Kerry, G. et al. Allergy or tolerance in children sensitized to peanut: prevalence and differentiation using component-resolved diagnostics. J Allergy Clin Immunol. 2010; 125: 191–197 (e1-13)
Abstract | Full Text | Full Text PDF | PubMed | Scopus (291) | Google ScholarSee all References By using microarray component-resolved diagnostics among peanut-sensitized children, we demonstrated marked differences in the component sensitization profile between subjects with peanut allergy and peanut-tolerant subjects, with IgE response to Ara h 2 being the most important predictor of allergy.5x5Nicolaou, N., Poorafshar, M., Murray, C., Simpson, A., Winell, H., Kerry, G. et al. Allergy or tolerance in children sensitized to peanut: prevalence and differentiation using component-resolved diagnostics. J Allergy Clin Immunol. 2010; 125: 191–197 (e1-13)
Abstract | Full Text | Full Text PDF | PubMed | Scopus (291) | Google ScholarSee all References However, despite progress in this technology, because of issues related to standardization, cost, and interpretation, this tool is not as yet ready for routine use. In the current study we aimed to compare the quantification of sIgE to whole peanut extract and the peanut components Ara h 1, 2, 3, 8, and 9 using the standard ImmunoCAP method (Phadia, Uppsala, Sweden) in predicting peanut allergy or tolerance.
Of 81 children (age, 7-14 years) with sIgE to whole peanut extract who participated in the original study (29 with peanut allergy and 52 peanut-tolerant),5x5Nicolaou, N., Poorafshar, M., Murray, C., Simpson, A., Winell, H., Kerry, G. et al. Allergy or tolerance in children sensitized to peanut: prevalence and differentiation using component-resolved diagnostics. J Allergy Clin Immunol. 2010; 125: 191–197 (e1-13)
Abstract | Full Text | Full Text PDF | PubMed | Scopus (291) | Google ScholarSee all References 80 had sIgE to Ara h 2, and 66 (27 with peanut allergy and 39 peanut-tolerant) had sIgE to all components. Peanut allergy was confirmed by means of oral food challenge, as previously described.5x5Nicolaou, N., Poorafshar, M., Murray, C., Simpson, A., Winell, H., Kerry, G. et al. Allergy or tolerance in children sensitized to peanut: prevalence and differentiation using component-resolved diagnostics. J Allergy Clin Immunol. 2010; 125: 191–197 (e1-13)
Abstract | Full Text | Full Text PDF | PubMed | Scopus (291) | Google ScholarSee all References Challenge was considered positive after development of at least 2 objective signs (eg, skin rash, sneezing, vomiting, cough, wheeze, and >20% decrease in FEV1).5
We compared the diagnostic performance of sIgE measurement to different components and whole extract in discriminating between subjects with peanut allergy and those tolerant to peanut using receiver operating characteristic (ROC) curve analysis6x6Zweig, M.H. and Campbell, G. Receiver-operating characteristic (ROC) plots: a fundamental evaluation tool in Clinical Medicine. Clin Chem. 1993; 39: 561–577
PubMed | Google ScholarSee all References (Stata 11.0; StataCorp, College Station, Tex). Fig 1Fig 1 shows the true-positive rate (sensitivity) plotted in function of the false-positive rate (1-specificity) for different cutoff points for the quantified components and whole peanut extract. Each point on the ROC curve represents a sensitivity/specificity pair corresponding to a particular decision threshold. A test with perfect discrimination has a ROC curve that passes through the upper left corner (100% sensitivity and 100% specificity). Therefore the closer the ROC plot is to the upper left corner, the higher the overall accuracy of the test.6x6Zweig, M.H. and Campbell, G. Receiver-operating characteristic (ROC) plots: a fundamental evaluation tool in Clinical Medicine. Clin Chem. 1993; 39: 561–577
PubMed | Google ScholarSee all References According to this criterion, sIgE measurement to Ara h 2 appears to be the test with the highest accuracy for discriminating allergy from tolerance.
We used estimated area under the ROC curves as an indicator of diagnostic accuracy and observed a significant difference between the tests (χ2 = 61.59, P < .001). As indicated by the estimated area under the ROC curves, sIgE to Ara h 2 had the highest accuracy in differentiating between children with peanut allergy and those tolerant to peanut: area (95% CI), Ara h 2 0.99 (0.99-1.00), whole peanut extract 0.85 (0.74-0.96), Ara h 1 0.84 (0.73-0.95), Ara h 3 0.77 (0.64-0.89), Ara h 9 0.52 (0.37-0.66), and Ara h 8 0.50 (0.36-0.65).
Table ITable I shows a range of cutoff points for component Ara h 2 and whole peanut extract based on sensitivity and specificity because the measure of sensitivity and specificity for a single cutoff point might be inadequate for evaluating the optimal diagnostic test. As an example, we considered a hypothetical scenario in which we are seeking to discriminate allergy from tolerance among 100 children sensitized to peanuts, of whom 50 have peanut allergy and 50 are peanut-tolerant. By using sIgE to component Ara h 2 with a cutoff point of 0.35 kUA/L, all children with peanut allergy would be correctly classified. The specificity of this test is given as 96.1% (Table ITable I). In this example we expect 2 children who are not allergic to peanuts to be misclassified as having peanut allergy and the other 48 children to have a negative result. By using this cutoff point, 97.5% of the population is correctly classified.
A similar proportion of children would be correctly classified by using a cutoff point of 0.55 kUA/L; however, in this case 3 children with peanut allergy would be misclassified as tolerant. This cutoff point corresponds to a gain in specificity (100%) but a loss in sensitivity (93.1%). Given the importance of not misdiagnosing children with peanut allergy as being tolerant, we propose that the optimal cutoff point in our population is 0.35 kUA/L.
The cutoff for whole peanut sIgE of 5.30 kUA/L provides the maximum proportion of correctly classified subjects (87.6%), with a sensitivity of 75.9% and a specificity of 94.2%. However, approximately 24% of children with peanut allergy would be inappropriately classified as peanut-tolerant. The cutoff of 15 kUA/L has excellent specificity, with 96.2% of children at greater than this level being correctly classified as allergic; however, this decision point has relatively poor sensitivity, with almost half of the subjects with peanut allergy being classified as tolerant. These data suggest that in our population the quantification of whole peanut sIgE has lower accuracy in discriminating peanut allergy from tolerance compared with quantification of sIgE to Ara h 2.
In conclusion, having identified sIgE to Ara h 2 as an important predictor of clinical reactivity to peanut using microarray technology,5x5Nicolaou, N., Poorafshar, M., Murray, C., Simpson, A., Winell, H., Kerry, G. et al. Allergy or tolerance in children sensitized to peanut: prevalence and differentiation using component-resolved diagnostics. J Allergy Clin Immunol. 2010; 125: 191–197 (e1-13)
Abstract | Full Text | Full Text PDF | PubMed | Scopus (291) | Google ScholarSee all References we have now demonstrated the value of its quantification using a routinely available laboratory test. Among school-aged children in the United Kingdom, a cutoff of 0.35 kUA/L Ara h 2 IgE confers 100% sensitivity and 96.1% specificity. By using this cutoff point, 97.5% of the subjects in our study population were correctly classified, with all children with peanut allergy given the correct classification. The importance of Ara h 2 has been suggested in studies from other Central and Northern European countries7x7Astier, C., Morisset, M., Roitel, O., Codreanu, F., Jacquenet, S., Franck, P. et al. Predictive value of skin prick tests using recombinant allergens for diagnosis of peanut allergy. J Allergy Clin Immunol. 2006; 118: 250–256
Abstract | Full Text | Full Text PDF | PubMed | Scopus (163) | Google ScholarSee all References, 8x8Flinterman, A.E., van Hoffen, E., den Hartog Jager, C.F., Koppelman, S., Pasmans, S.G., Hoekstra, M.O. et al. Children with peanut allergy recognize predominantly Ara h2 and Ara h6, which remains stable over time. Clin Exp Allergy. 2007; 37: 1221–1228
Crossref | PubMed | Scopus (101) | Google ScholarSee all References; however, in other populations and geographic areas, IgE to other components might be relevant (eg, Ara h 9 in the Mediterranean9x9Krause, S., Reese, G., Randow, S., Zennaro, D., Quaratino, D., Palazzo, P. et al. Lipid transfer protein (Ara h 9) as a new peanut allergen relevant for a Mediterranean allergic population. J Allergy Clin Immunol. 2009; 124: 771–778 (e5)
Abstract | Full Text | Full Text PDF | PubMed | Scopus (144) | Google ScholarSee all References). Our findings need to be replicated in other populations and age groups before general application.
All Author:
Nicolaos Nicolaou Clare Murray Maryam Poorafshar Angela Simpson Adnan Custovic
2019-11- 12 Article
创建过敏性疾病的科研、科普知识交流平台,为过敏患者提供专业诊断、治疗、预防的共享平台。